Studies show that data-driven businesses are up to 23 times more likely to acquire customers and 19 times more likely to stay profitable compared to those that rely on intuition alone. In e-commerce, those numbers make all the difference — and it all starts with tracking the right metrics.
In this article, we’ll walk you through the key performance indicators (KPIs) every online store owner should track, how often to check them, and the benefits of monitoring your business metrics regularly.

What Are Metrics and KPIs, and Why Do They Matter?
We mentioned the numbers, called them metrics and then labeled them “KPIs”. So, what’s the difference between these terms?
You see, not all numbers in your online store are created equal. You might be tempted to track everything, but in reality only some of those numbers truly reflect the health and growth of your business. These are called Key Performance Indicators (KPIs).
Metrics vs. KPIs
A metric is any measurable piece of data, such as the number of visitors on Monday versus Wednesday. These numbers can be interesting, but they don’t always show whether your business is on the right track. A KPI, on the other hand, is different: it connects directly to your core business goals, like increasing profits, improving efficiency, or building customer loyalty. For example, daily sales figures are metrics, but conversion rate is a KPI because it shows how effectively you turn visitors into paying customers — a result that directly impacts your revenue.
The Key Properties of KPIs
There are three qualities that make KPIs stand out from other metrics:
- High impact — When a KPI changes, it significantly affects your business as a whole. For example, a sudden drop in conversion rate will immediately reduce sales, even if traffic remains the same.
- Goal alignment — A KPI helps you achieve a specific business goal. If your goal is profitability, Customer Acquisition Cost (CAC) becomes critical, because keeping this number under control means your growth is sustainable.
- Ripple effect — KPIs often influence other smaller metrics. For example, if your Customer Retention Rate improves, you will most likely see an increase in Average Order Value and Customer Lifetime Value as well.
Choosing the Right Number of KPIs
Another common mistake is trying to track too many KPIs at once. This creates confusion and makes it hard to focus. The best approach is to set clear goals and assign only two or three KPIs to each. For instance, if your goal is growth, you might track conversion rate, CAC, and traffic sources. If your goal is stability, you might focus on retention rate and refund rate.
By treating KPIs as the compass of your business, you’ll always know whether you’re moving toward your goals, instead of drowning in spreadsheets that span thousands of rows and columns.

Financial Metrics
Financial metrics show how much your business earns and where exactly that revenue comes from. They reflect the monetary side of your store’s performance and highlight whether your operations are profitable and sustainable.
1. Gross Merchandise Volume (GMV)
What it is: GMV is the total value of all sales made through your online store over a specific period.
Why it’s important:
- It shows the scale of your business — a higher GMV means your store is actively generating sales
- GMV helps you track growth over time. For instance, a 30% increase in GMV compared to last quarter is a strong sign of momentum
- It provides a baseline for other KPIs like profit margin or return rate
Example: If Store A and Store B both earn $10,000 in revenue, but Store A has a GMV of $20,000 and Store B has a GMV of $40,000, you can immediately see that Store B operates on a larger scale.
How to calculate it:

What it affects: GMV influences almost every other financial KPI — from profit margin to refund rate.
2. Average Order Value (AOV)
What it is: The average amount a customer spends each time they place an order.
Why it’s important:
- It shows how much value each transaction brings
- A higher AOV means you can generate more revenue without needing more traffic
- You can test strategies like product bundles, upsells, or free-shipping thresholds to raise AOV
Example: If your AOV is $50 and you raise it to $60, with 1,000 monthly orders, that’s an extra $10,000 revenue without acquiring a single new customer.
How to calculate it:

What it affects: AOV connects closely with Customer Lifetime Value (CLV) and profit margin.
3. Profit Margin
What it is: The percentage of revenue that remains as profit after subtracting all costs.
Why it’s important:
- It shows whether your business is truly profitable, not just selling a lot
- A low margin might mean you’re spending too much on ads, shipping, or supplier costs
- Healthy margins allow you to reinvest into marketing or product development
Example: Two stores both make $50,000 in sales. Store A keeps $10,000 (20% margin), Store B keeps $2,500 (5% margin). Store A has much more room to grow.
How to calculate it:

What it affects: It directly impacts cost per order and cost revenue ratio.
4. Cost Per Order (CPO)
What it is: The average cost you incur to process and fulfill one customer order.
Why it’s important:
- It shows how efficient your operations are
- High CPO can reveal problems in shipping, packaging, or fulfillment
- Lowering CPO frees up more margin to reinvest
Example: If your CPO drops from $12 to $9 with 2,000 monthly orders, you’ve saved $6,000 without reducing quality.
How to calculate it:

What it affects: It impacts profit margin and cost revenue ratio.
5. Cost Revenue Ratio (CRR)
What it is: The ratio of costs compared to total revenue, usually expressed as a percentage.
Why it’s important:
- It helps measure overall efficiency — how much you spend to generate every dollar of revenue
- A high CRR means costs are consuming too much of your revenue, even if sales look good
Example: If your CRR is 80%, you keep only 20 cents per dollar earned. Reducing it to 60% doubles your profits.
How to calculate it:

What it affects: CRR reflects the overall financial health of your store.
6. Product Revenue
What it is: The revenue generated from each product or product category.
Why it’s important:
- It shows you which products are your bestsellers and which may not be worth the effort
- Helps in inventory planning — you can stock more of high-revenue products
- Guides marketing focus — you can promote products with proven demand
Example: If one product makes up 40% of revenue, you know where to double down on advertising.
How to calculate it:

What it affects: Product revenue shapes inventory management, AOV, and marketing ROI.
Conversion & Behavior Metrics
Conversion and behavior metrics reveal how visitors interact with your store and how effectively you turn traffic into sales. They help you spot weak points in the buying journey and improve the customer experience.
1. Conversion Rate
What it is: The percentage of visitors who complete a desired action — most often making a purchase.
Why it’s important:
- It shows how well your store turns traffic into paying customers
- A low conversion rate could signal problems with product pages, pricing, or checkout flow
- Even a small increase has a big impact — raising conversion from 2% to 3% means 50% more sales with the same traffic
Example: If 1,000 people visit and 30 buy, your conversion rate is 3%. Raising it to 4% would add 10 more sales without extra ad spend.
How to calculate it:

What it affects: Conversion rate impacts revenue growth, ROAS (Return on Ad Spend), and customer acquisition costs.
2. Shopping Cart Abandonment Rate
What it is: The percentage of customers who add products to their cart but leave without completing the purchase.
Why it’s important:
- It highlights friction in the checkout process — unclear shipping costs, limited payment options, or too many steps
- Reducing abandonment directly boosts sales without acquiring new traffic
Example: If 500 shoppers add products to their cart but only 250 complete the checkout, your abandonment rate is 50%. Improving checkout usability could turn many of those lost sales into revenue.
How to calculate it:

What it affects: It influences conversion rate, revenue per visitor, and customer satisfaction.
3. Bounce Rate
What it is: The percentage of visitors who land on your site and leave without taking any further action.
Why it’s important:
- A high bounce rate suggests your landing pages aren’t engaging or relevant
- It may indicate slow load times, poor design, or mismatched ad targeting
- Reducing bounce rate keeps more visitors in your sales funnel
Example: If 70% of visitors leave after one page, you’re losing potential buyers before they even explore products.
How to calculate it:

What it affects: Bounce rate impacts conversion rate, traffic quality, and overall customer acquisition costs.
Customer Retention & Loyalty Metrics
Retention and loyalty metrics measure the long-term health of your business. Acquiring new customers is expensive, so keeping existing ones engaged and encouraging them to buy again is one of the most effective ways to grow profitably.
1. Customer Lifetime Value (CLV)
What it is: The total revenue a business can expect from a single customer during their entire relationship with the store.
Why it’s important:
- CLV shows how much a customer is truly worth beyond the first purchase
- A high CLV means you can spend more on marketing to acquire similar customers
- It highlights the importance of repeat purchases and loyalty programs
Example: If your average customer spends $100 every three months and stays active for two years, their CLV is $800.
How to calculate it (simplified):

What it affects: CLV influences acquisition costs, profit margin, and marketing ROI.
2. Retention Rate
What it is: The percentage of customers who return to your store and continue buying over a given period.
Why it’s important:
- Retention shows how well your store builds loyalty and trust
- It’s usually cheaper to retain existing customers than acquire new ones
- A small increase in retention (e.g., +5%) can boost profits significantly, since retained customers tend to spend more over time
Example: If 1,000 customers bought from you in January and 600 also bought in February, your retention rate is 60%.
How to calculate it:

What it affects: Retention impacts CLV, repeat purchase rate, and marketing efficiency.
3. Repeat Purchase Rate (RPR)
What it is: The percentage of customers who make more than one purchase.
Why it’s important:
- It indicates how many first-time buyers become long-term customers
- A strong RPR signals product-market fit and good customer experience
- You can boost RPR with email marketing, loyalty rewards, or subscription offers
Example: If 2,000 people shopped in your store and 500 of them made a second purchase, your repeat purchase rate is 25%.
How to calculate it:

What it affects: It drives CLV, retention rate, and average revenue per user.
4. Average Revenue Per User (ARPU)
What it is: The average amount of revenue generated per active customer over a given time period.
Why it’s important:
- ARPU helps you understand how valuable your customer base is at scale
- It can guide pricing strategies, upsell tactics, and product development
- Monitoring ARPU trends helps spot whether customers are spending more or less over time
Example: If your store made $50,000 last month from 2,000 active customers, your ARPU is $25.
How to calculate it:

What it affects: ARPU ties into CLV, AOV, and overall business scalability.
Marketing & Acquisition Metrics
Marketing and acquisition metrics measure how efficiently you bring in new visitors and customers. They help you evaluate whether your advertising spend and promotional strategies are truly driving growth.
1. Total Traffic
What it is: The total number of visitors who land on your store within a given period.
Why it’s important:
- It shows your store’s reach and visibility
- Traffic volume helps you spot growth trends from SEO, ads, or social media campaigns
- High traffic with low sales highlights issues in conversion or targeting
Example: If traffic doubled after launching a Google Ads campaign but sales stayed flat, it may indicate poor targeting.
How to calculate it: You can find it in your shop’s dashboard
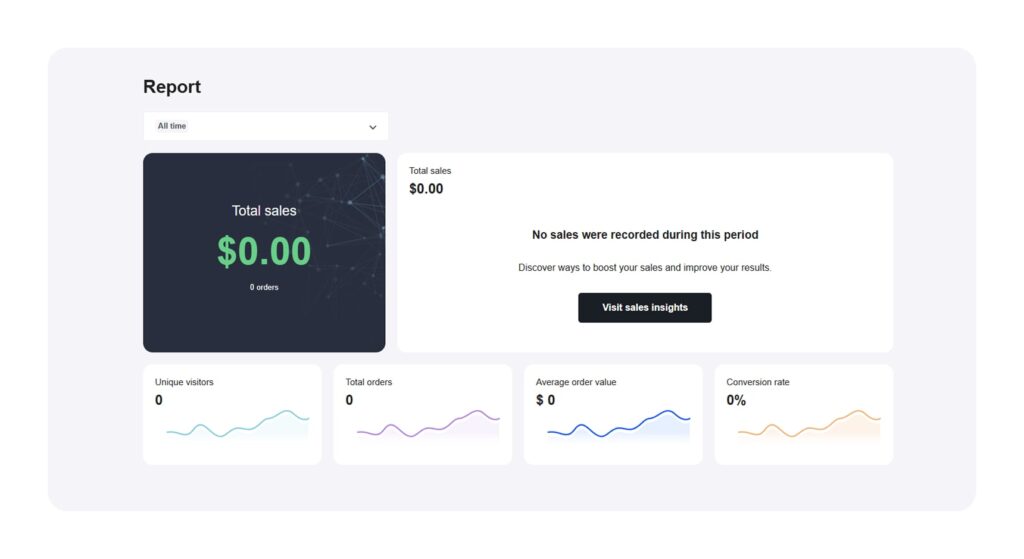
What it affects: Traffic directly affects conversion rate, bounce rate, and acquisition costs.
2. Customer Acquisition Cost (CAC)
What it is: The average amount you spend to acquire a single paying customer.
Why it’s important:
- CAC helps you understand whether your growth is sustainable and profitable
- A high CAC means you’re overspending on ads compared to the revenue customers bring in
Example: If you spend $1,000 on ads and gain 50 new customers, your CAC is $20. If their CLV is only $25, profit is thin.
How to calculate it:

What it affects: CAC ties directly to CLV, ROAS, and profit margin.
3. Return on Advertising Spend (ROAS)
What it is: A measure of how much revenue you earn for every dollar spent on advertising.
Why it’s important:
- It shows whether your ad campaigns are profitable or wasting money
- A ROAS above 1 means you earn more than you spend; below 1 means you’re losing money
Example: Spend $500 on Facebook ads and generate $2,000 in sales = ROAS of 4.
How to calculate it:

What it affects: ROAS connects with profitability, CAC, and return on marketing investment (ROMI).
4. Cost Per Click (CPC)
What it is: The amount you pay each time someone clicks your ad.
Why it’s important:
- CPC shows how competitive your market is for paid ads
- A lower CPC allows more clicks for the same budget, but quality of traffic matters
Example: If you spend $200 for 400 ad clicks, CPC = $0.50
How to calculate it:

What it affects: CPC influences CAC, CTR, and ROAS.
5. Click Through Rate (CTR)
What it is: The percentage of people who click your ad or link compared to how many saw it.
Why it’s important:
- CTR shows whether your ads or listings are relevant and engaging
- A low CTR signals weak ad copy, poor visuals, or irrelevant targeting
Example: If 10,000 people saw your ad and 300 clicked, CTR is 3%.
How to calculate it:

What it affects: CTR impacts CPC, traffic quality, and overall ROAS.
6. Cost Per Action (CPA)
What it is: The average cost of a specific desired action — such as a sign-up, download, or purchase.
Why it’s important:
- CPA goes beyond clicks and focuses on actual results
- It’s one of the best measures for campaign performance in performance marketing
Example: If you spend $1,000 and 100 people make purchases, your CPA is $10 per action.
How to calculate it:

What it affects: CPA influences CAC, ROAS, and overall marketing ROI.
7. Daily/Weekly/Monthly Active Users (DAU/WAU/MAU)
What it is: The number of unique users who interact with your store over a specific time frame (day, week, or month).
Why it’s important:
- These metrics measure engagement and stickiness of your store
- A high DAU/MAU ratio means people visit frequently, which signals strong loyalty
Example: If 1,000 users visit monthly but 500 come back daily, engagement is excellent.
How to calculate it: Tracked through analytics tools (Google Analytics, Offiro dashboards)
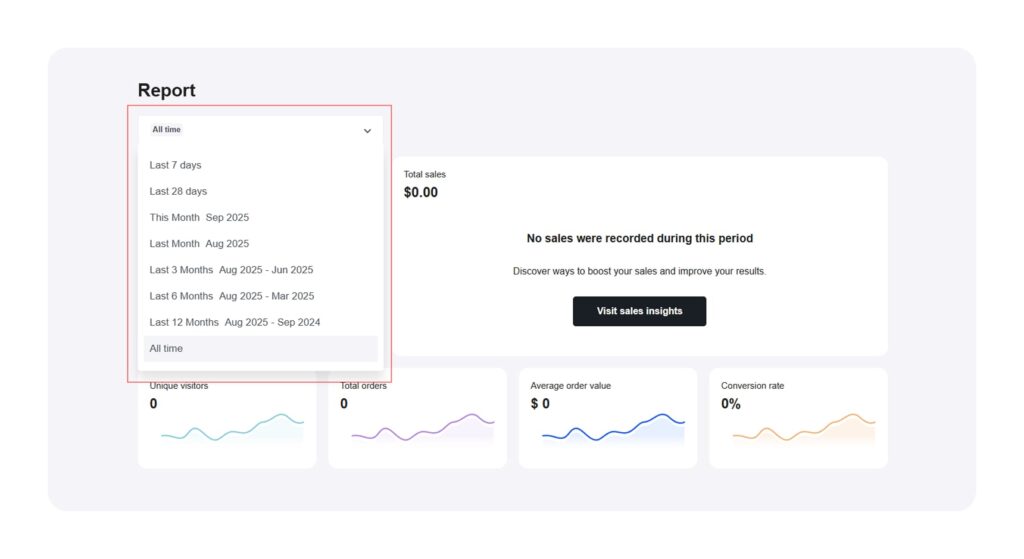
What it affects: Active user metrics tie into retention, ARPU, and CLV.
8. Return on Marketing Investment (ROMI)
What it is: A broader version of ROAS that looks at the total return from all marketing efforts, not just advertising.
Why it’s important:
- ROMI shows the true efficiency of all marketing activities (ads, content, email, influencers)
- It helps justify marketing budgets and guides strategic investments
Example: If you spend $10,000 across all marketing channels and generate $50,000 in incremental revenue, ROMI = 5.
How to calculate it:

What it affects: ROMI influences decisions on budget allocation, campaign scaling, and business growth.
Customer Satisfaction & Quality Metrics
Satisfaction and quality metrics reveal how well your business delivers on customer expectations. They don’t just measure sales — they measure trust, loyalty, and the likelihood that customers will recommend you to others.
1. Net Promoter Score (NPS)
What it is: A survey-based metric that measures how likely customers are to recommend your store to friends or colleagues, usually on a 0–10 scale.
Why it’s important:
- NPS is one of the clearest indicators of customer loyalty and brand strength
- A high NPS means happy customers who can generate free word-of-mouth referrals
Example: If your store has a score of 70, you’re in excellent territory — most customers love their experience and will promote it.
How to calculate it:

What it affects: NPS influences retention rate, repeat purchase rate, and overall brand reputation.
2. Refund and Return Rate
What it is: The percentage of sold products that customers return or request refunds for.
Why it’s important:
- High return rates can signal quality issues, misleading product descriptions, or poor fit
- Returns eat into your profit margin and create extra logistics costs
Example: If 100 orders go out and 12 come back, your return rate is 12% — too high in most industries.
How to calculate it:

What it affects: This metric impacts profit margin, customer satisfaction, and operational efficiency.
3. Delivery Performance
What it is: A measure of how reliably and quickly you deliver products to customers. This often includes on-time delivery rate, average delivery time, and successful delivery rate.
Why it’s important:
- Delivery is often the final impression customers have of your store
- Late or failed deliveries can damage trust and increase refund requests
- Strong delivery performance builds loyalty and can differentiate you from competitors
Example: If 95% of your orders arrive on or before the promised date, customers are much more likely to buy again.
How to calculate it:

What it affects: Delivery performance impacts NPS, return rate, and customer retention.
Why Tracking Metrics Regularly Matters
Your success comes from consistent, regular monitoring of metrics. Without regular check-ins, small problems can snowball into major setbacks.
By tracking KPIs weekly or even daily, you can:
- Spot issues early — a sudden dip in conversion rate may reveal a broken checkout page.
- Adapt your strategy quickly — if ad costs rise, you can immediately adjust targeting or switch channels.
- Measure the impact of changes — whether you launch a new product or test a promotion, metrics will show you what’s working.
- Build habits of data-driven decision-making instead of relying on intuition.
The good news is you don’t have to do this manually. Every store on Offiro runs on the Sellvia platform, which comes with a built- in dashboard showing you all the critical metrics in real time. It’s designed to make tracking simple, even if you’re new to eCommerce.
And you’re never alone: Offiro’s experts are always available to help. Whether you need clarity on what the numbers mean or advice on how to act on them, our team is here to guide you toward smarter, more profitable decisions.
Metrics do not just measure progress. They help you act sooner and scale with confidence. With Offiro, you’ll always have the tools and expertise to turn insights into results.


